
Python Statistics Fundamentals: Math and statistics are essential for data science because these disciples form the solid foundation of all the machine learning algorithms. Mathematics is a part of every aspect of our lives. Mathematics and Statistics, in fact, are behind everything that surrounds us, from shapes, patterns, and colors to counting petals in flower. A key aspect of working with data is the ability to describe, summarize and represent data visually. Python Statistics Libraries are thorough, accessible,and commonly used tools that will help you work with your data.
Python Statistics Library
Statistics is a Mathematical Science about data collection, analysis, interpretation, and presentation. Statistics are used to handle complex real-world problems, so data scientists and analysts can look for meaningful data trends and changes. In plain words, Statistics can be used by carrying out mathematical computations on it to extract useful insights from data.
The python statistics module provides functions for calculating mathematical statistics of numeric.
1) Measures of Central Tendency: The measures of central tendency show the central or middle values of datasets. There are several definitions of what’s considered to be the center of a dataset. In this, you will learn how to identify and calculate these measures of central tendency:
- Mean
- Median
- Median_low
- Median_high
- Median_grouped
- Mode
| Functions | Descriptions |
| mean() | Arithmetic mean (“average”) of data. |
| median() | Median (middle value) of data. |
| median_low() | Low median of data. |
| median_high() | High median of data. |
| median_grouped() | Median, or 50th percentile, of grouped data. |
| mode() | Single mode (most common value) of discrete or nominal data. |
Mean : The “average” number; found by adding all data points and dividing by the number of data points.
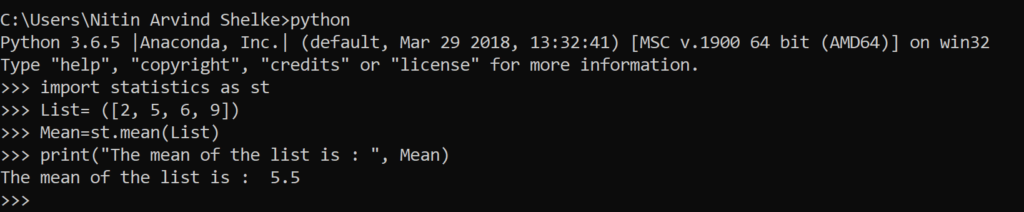
#Example 1.1 The mean() method calculates the arithmetic mean of the numbers in a list.
>>> import statistics as st
>>> List= ([2, 5, 6, 9])
>>> Mean=st.mean(List)
>>> print(“The mean of the list is : “, Mean)
The mean of the list is : 5.5
Median: The middle number; found by ordering all data points and picking out the one in the middle (or if there are two middle numbers, taking the mean of those two numbers).
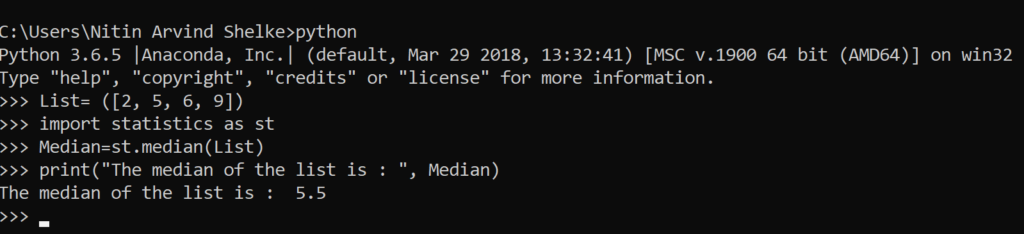
#Example 1.2 median() method returns the middle value of numeric data in a list.
>>> List= ([2, 5, 6, 9])
>>> import statistics as st
>>> Median=st.median(List)
>>> print(“The median of the list is : “, Median)
The median of the list is : 5.5
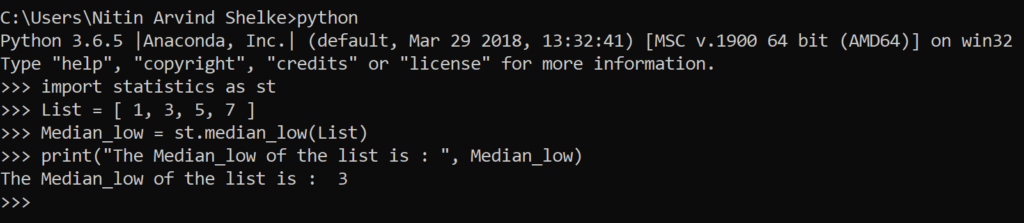
Median_low: When the number of data points is odd, the middle value is returned. When it is even, the smaller of the two middle values is returned.
#Example 1.3 The median_low() method returns the low median of numeric data.
>>> import statistics as st
>>> List = [ 1, 3, 5, 7 ]
>>> Median_low = st.median_low(List)
>>> print(“The Median_low of the list is : “, Median_low)
The Median_low of the list is : 3
>>>
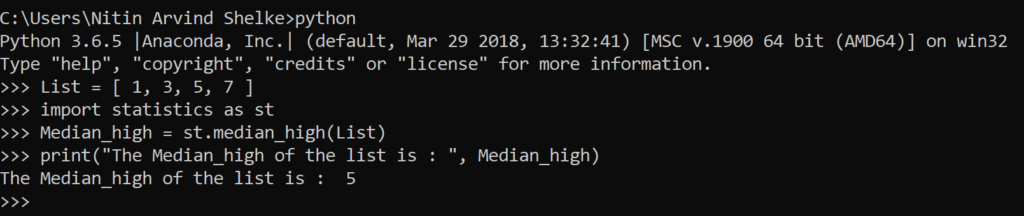
Median_high: When the number of data points is odd, the middle value is returned. When it is even, the larger of the two middle values is returned.
#Example 1.4 The median_high() method returns the high median of numeric data.
>>> List = [ 1, 3, 5, 7 ]
>>> import statistics as st
>>> Median_high = st.median_high(List)
>>> print(“The Median_high of the list is : “, Median_high)
The Median_high of the list is : 5
>>>
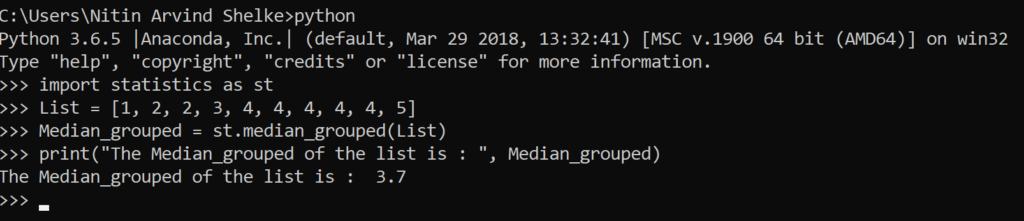
Median_grouped: Return the median of grouped continuous data, calculated as the 50th percentile, using interpolation. If data is empty, Statistics Error is raised.
In the following example, the data are rounded, so that each value represents the midpoint of data classes, e.g., 1 is the midpoint of the class 0.5-1.5, 2 is the midpoint of 1.5-2.5, 3 is the midpoint of 2.5-3.5, etc. With the data given, the middle value falls somewhere in the class 3.5-4.5, and interpolation is used to estimate it:
#Example 1.5 The median_ grouped () method returns the grouped median of numeric data.
>>> import statistics as st
>>> List = [1, 2, 2, 3, 4, 4, 4, 4, 4, 5]
>>> Median_grouped = st.median_grouped(List)
>>> print(“The Median_grouped of the list is : “, Median_grouped)
The Median_grouped of the list is : 3.7
>>>
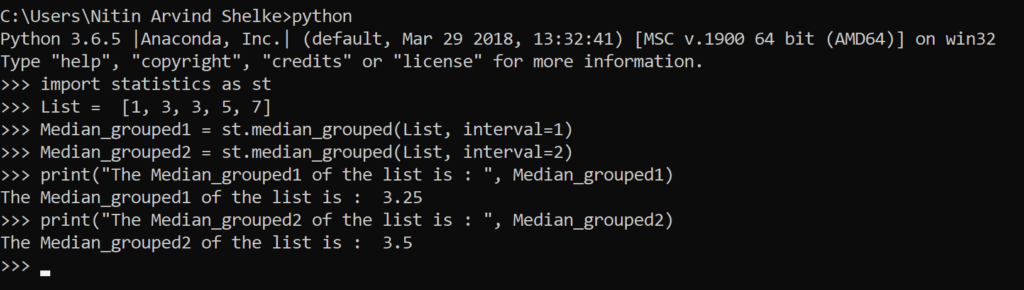
#Example 1.6 The median_ grouped () method returns the grouped median with interval of numeric data. Optional argument interval represents the class interval, and defaults to 1. Changing the class interval naturally will change the interpolation:
>>> import statistics as st
>>> List = [1, 3, 3, 5, 7]
>>> Median_grouped1 = st.median_grouped(List, interval=1)
>>> Median_grouped2 = st.median_grouped(List, interval=2)
>>> print(“The Median_grouped1 of the list is : “, Median_grouped1)
The Median_grouped1 of the list is : 3.25
>>> print(“The Median_grouped2 of the list is : “, Median_grouped2)
The Median_grouped2 of the list is : 3.5
>>>
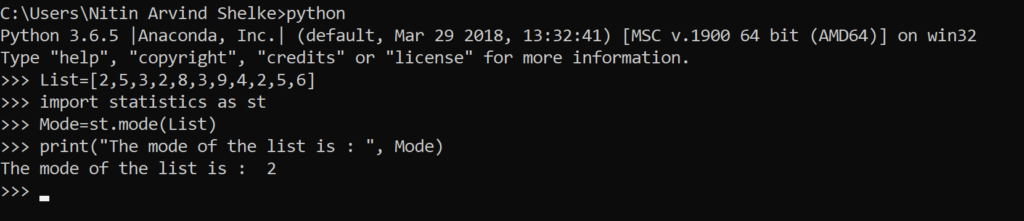
Mode: The most frequent number—that is, the number that occurs the highest number of times.
#Example 1.7 The mode() method returns the most common data point in the list.
>>> List=[2,5,3,2,8,3,9,4,2,5,6]
>>> import statistics as st
>>> Mode=st.mode(List)
>>> print(“The mode of the list is : “, Mode)
The mode of the list is : 2
>>>
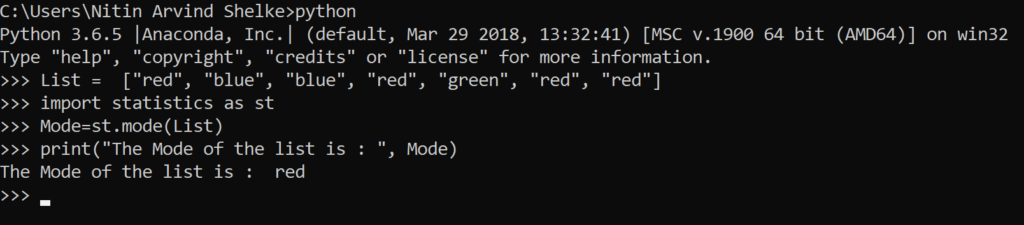
#Example 1.8 The mode() method returns the most common data point in the list.
>>> List = [“red”, “blue”, “blue”, “red”, “green”, “red”, “red”]
>>> import statistics as st
>>> Mode=st.mode(List)
>>> print(“The Mode of the list is : “, Mode)
The Mode of the list is : red
>>>
2) Measures of Variability: The measures of central tendency aren’t sufficient to describe data. You’ll also need the measures of variability that quantify the spread of data points. In this section, you’ll learn how to identify and calculate the following variability measures:
- Standard Deviation
- Variance
| Functions | Descriptions |
| stdev() | Arithmetic mean (“average”) of data. |
| variance() | Sample variance of data. |
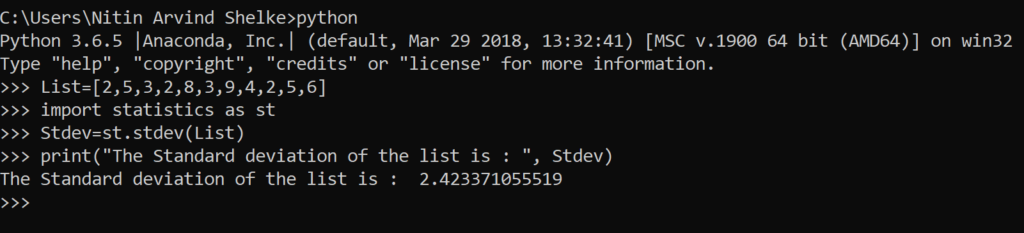
Standard Deviation: In statistics, the standard deviation is a measure of the amount of variation or dispersion of a set of values. A low standard deviation indicates that the values tend to be close to the mean of the set, while a high standard deviation indicates that the values are spread out over a wider range.
#Example 1.9 The stdev() method calculates the standard deviation on a given sample in the form of a list.
>>> List = [ 2,5,3,2,8,3,9,4,2,5,6 ]
>>> import statistics as st
>>> Stdev=st.stdev(List)
>>> print ( ” The Standard deviation of the list is : ” , Stdev )
The Standard deviation of the list is : 2.423371055519
>>>
Variance: In probability theory and statistics, variance is the expectation of the squared deviation of a random variable from its mean.
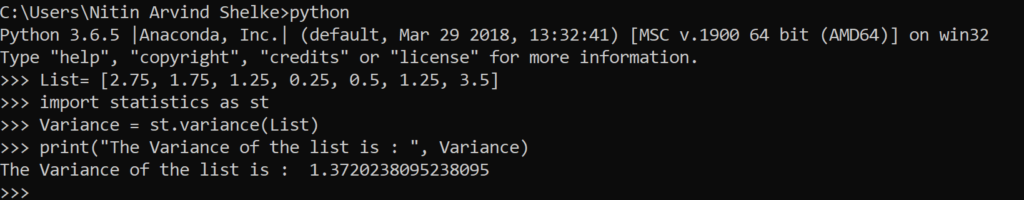
#Example 1.10 The variance() method calculates the variance on a given sample in the form of a list.
>>> List = [2.75, 1.75, 1.25, 0.25, 0.5, 1.25, 3.5]
>>> import statistics as st
>>> Variance = st.variance(List)
>>> print (” The Variance of the list is : “, Variance )
The Variance of the list is : 1.3720238095238095
>>>