Data Visualization vs. Business Intelligence – Introduction:
Data Visualization vs. Business Intelligence – Everyday data is piling up. Very large amount of Data. It’s very difficult to maintain and process these data. These data are in different formats and structure. Companies are coming up with different tools and software’s to process these data and to monetize from these data.
Data Visualization:
Let me explain this term in layman word, It is to tell story from your data. Anyone can understand what this data about? What is explained on the dashboard?
Representation of the data. Data scientists need tools to deal with the data. What can best value be brought out of it? How can it be broken down? How is one parameter correlated to other? These are the questions which can be answered by understanding Data Visualisations.
I would like to define Data visualization as it is the process of interacting with clients to understand patterns, trends, and insights by transforming data into a visual context. Data visualisation is to generate visuals from the data. It can be in any form like tables, graphs, charts, images, patterns, movies, etc.
Business Intelligence:
Business Intelligence tools and applications are used to analyse data from business operations and transform raw data into meaningful, useful and actionable information. The first step to any form of Business Intelligence consists in gathering raw data or historical data. After that Business Intelligence tools helps in visualization, reporting, and analytics functions which is used to interpret large volumes of data from the raw data.
Data Visualisation vs. Business Intelligence:
Below are the artefacts distinguishing between Data Visualisation and Business Intelligence.
Objectives:
Data Visualisation – It represents information to be quickly learned and understandable.
Business Intelligence – It refers to data-driven decision making with the help of aggregation, analysis and visualization of data to strategize and manage business processes and policies
Definition:
Data Visualisation – Data visualization is the process of helping people or clients to understand patterns, trends, and insights by transforming data into a visual context.
Business Intelligence – Business Intelligence tools and applications are used to analyse data from business operations and transform raw data into meaningful, useful and actionable information.
Expertise:
Data Visualisation – It is typically easier to operate than traditional statistical analysis software.
Business Intelligence – It involves varied processes and procedures which help in data collection, sharing and reporting to ensure better decision making.
Mainly for:
Data Visualisation – Data Visualisations can be used in real-time as well as Batch processing. But mostly in Batch processing.
Business Intelligence – Business Intelligence can be used in real-time as well as Batch processing.
Data Types:
Data Visualisation – It deals with mostly structured data
Business Intelligence – It mostly deals with Historical sets of interrelated data
Focus:
Data Visualisation – It focuses on Reporting Data
Business Intelligence – It focuses on Business Data
Various Task:
Data Visualisation – It is used for Analytical problem.
Business Intelligence – It is used for Data Analytics, Data Mining and Big Data.
Used for:
Data Visualisation – Natural to represent things
Business Intelligence – Enterprise reporting and calculating Key Performance Indicators.
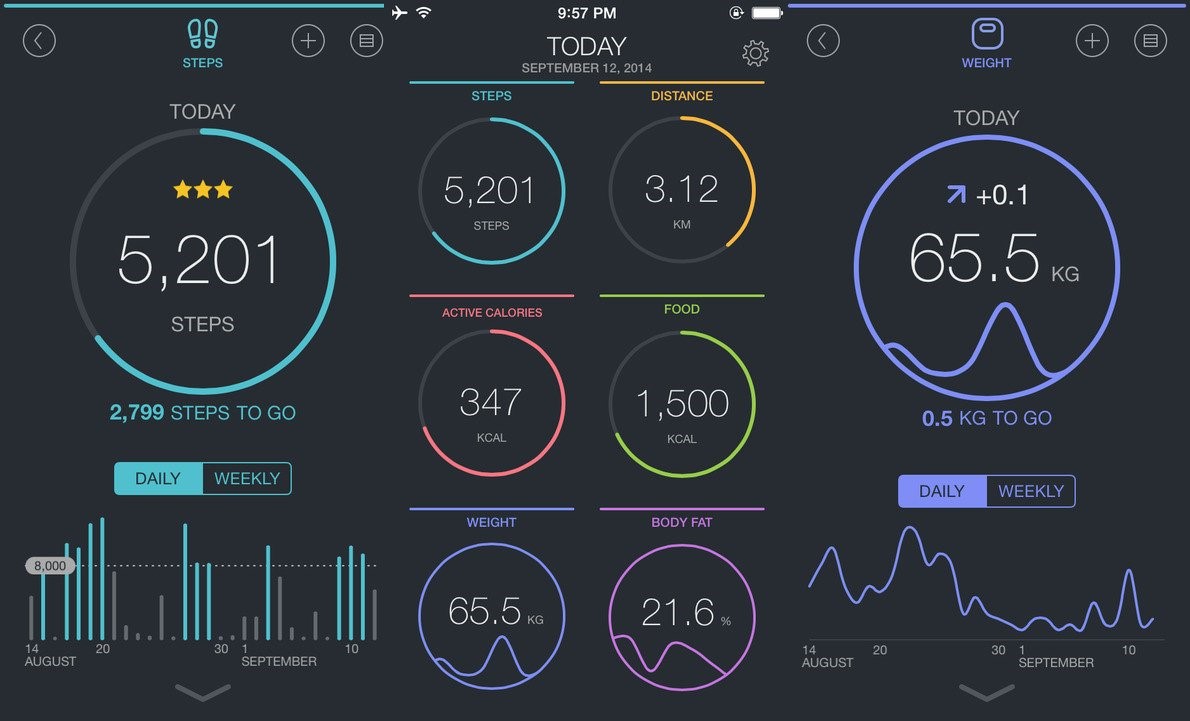
Anyone looking at below images can easily deprive story from below image. You can easily understand about different parameters. You can easily visualise different reports like steps, Calorie, Distance, Daily report, Weekly report. You can learn quickly and easily. You can interact easily with the data.
Features of Data Visualisations:
- Data visualization represents information so that it can be seen, in a way that it can be learned quickly and easily
- Data visualization feels be natural to represent things
- Data visualization focus on reporting data
- Data visualization means to interact with their data
- Data visualization deals generally with analytical problem
- Information of interest to be presented as a resolution sufficient to perform the task
- For POC to visualize the output and to monitor results to make ensure that models are performing as intended
Features of Business Intelligence:
- Business Intelligence is required to operate the business
- Business Intelligence tools are especially designed to display results of analytics in a manner understandable even to a layman
- Business Intelligence provides a global descriptive vision of an enterprise’s activity based on past data.
- Business Intelligence deals with analytics and reporting tools, which helps in determining trends using historical data.
- Business Intelligence helps in making business decisions based on past results
- Business Intelligence helps different organizations in better decision-making leveraging a wide range of latest tools and methods.
- Business Intelligence involves varied processes and procedures which help in data collection, sharing and reporting to ensure better decision making.
- Business Intelligence is the broadest category involving data analytics, data mining and big data.
- Business Intelligence tools make use of business data.
- Business Intelligence software should allow for a number of people to collaborate together and change existing data sets
- Business Intelligence is also essential for enterprise reporting and calculating Key Performance Indicators (KPIs).
- Business Intelligence focuses on achieving operational efficiency using real-time data to bring about efficiency in different job functions.
- Business Intelligence can range from very general contextual awareness to very specific use cases
- Business Intelligence is focused on situational awareness and developing context from meaningful business data.
Data Visualization vs. Business Intelligence – Conclusion:
Consumers live in a digital world of instant expectation. From digital sales transactions to marketing feedback and refinement, everything in today’s cloud-based business world moves fast. All these rapid transactions produce and compile data at an equally speedy rate. Putting this information to good use in real-time often means the difference between capitalizing on information for a 360 view of the target audience, and losing customers to competitors who do. Data Visualisation and Business Intelligence both are required together and play a very important part in Data Scientist team. They equally are part of any project. Business Intelligence is a process that makes easier to understand information and Data Visualisation is a method to tell story of information.